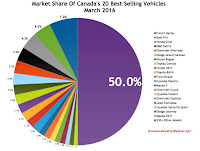
Canada's 20 best-selling autos – not even the top 30, but just the top 20 – accounted for precisely half of all new vehicle sales in March 2017.
Record March sales for the Ford F-Series, Canada's best-selling line of vehicles, along with surges from GM's pickups, huge upticks from some of Canada's most popular cars, and high-flying SUV/crossover sales propelled the industry to the best March results ever.
Not everyone got in on the fun. Year-over-year, Ram P/U sales slumped 6% in March 2017. The Hyundai Elantra, Canada's fourth-best-selling vehicle in March 2016 but only the 12th-ranked vehicle in March 2017, fell 35%.
But of the 30 most popular vehicles in Canada in March, 22 sold more often in 2017 than in the same period of 2016.  |
| Click Chart To Expand |
We've already published March lists for the 20 best-selling cars, 20 best-selling SUVs and crossovers, and complete figures for every pickup truck, links to which you'll find below.
Throwing all those vehicles into one group results in this list of the 30 best-selling vehicles overall.
We end up with four pickup trucks, two minivans, ten cars, and fourteen utility vehicles.
Historical monthly and yearly sales figures for any of these top-selling vehicles can always be accessed through the dropdown menu at GCBC's Sales Stats page, and for those not viewing the mobile version of this site, near the top right of this page, as well. Mobile users can now thumb across the table for full-width access.
February 2017 • March 2016 Rank | Vehicle | March
2017 | March
2016 | %
Change | 2017
YTD | 2016
YTD | %
Change |
#1 | Ford F-Series | 13,580 | 13,385 | 1.5% | 33,134 | 32,204 | 2.9% |
#2 | Ram P/U | 8,347 | 8,841 | -5.6% | 21,802 | 22,708 | -4.0% |
#3 | Honda Civic | 8,145 | 5,943 | 37.1% | 15,396 | 12,519 | 23.0% |
#4 | GMC Sierra | 6,726 | 5,047 | 33.3% | 13,105 | 11,559 | 13.4% |
#5 | Chevrolet Silverado | 6,061 | 4,446 | 36.3% | 11,991 | 10,362 | 15.7% |
#6 | Dodge Grand Caravan | 5,459 | 3,702 | 47.5% | 11,226 | 8,910 | 26.0% |
#7 | Nissan Rogue | 4,888 | 2,993 | 63.3% | 10,481 | 7,115 | 47.3% |
#8 | Toyota Corolla | 4,778 | 3,634 | 31.5% | 10,774 | 8,351 | 29.0% |
#9 | Honda CR-V | 4,374 | 3,974 | 10.1% | 10,465 | 8,725 | 19.9% |
#10 | Toyota RAV4 | 4,272 | 3,970 | 7.6% | 9,979 | 9,589 | 4.1% |
#11 | Ford Escape | 3,884 | 3,484 | 11.5% | 8,932 | 8,205 | 8.9% |
#12 | Hyundai Elantra | 3,723 | 5,692 | -34.6% | 8,057 | 11,578 | -30.4% |
#13 | Mazda 3 | 2,996 | 2,457 | 21.9% | 5,990 | 5,188 | 15.5% |
#14 | Chevrolet Cruze | 2,916 | 2,294 | 27.1% | 5,587 | 5,695 | -1.9% |
#15 | Hyundai Tucson | 2,589 | 1,792 | 44.5% | 5,652 | 4,331 | 30.5% |
#16 | Chevrolet Equinox | 2,493 | 1,544 | 61.5% | 5,178 | 3,603 | 43.7% |
#17 | Jeep Cherokee | 2,475 | 3,021 | -18.1% | 6,594 | 7,202 | -8.4% |
#18 | Hyundai Santa Fe Sport | 2,109 | 2,142 | -1.5% | 4,266 | 5,075 | -15.9% |
#19 | Dodge Journey | 2,027 | 1,449 | 39.9% | 4,513 | 3,554 | 27.0% |
#20 | Mazda CX-5 | 1,885 | 2,198 | -14.2% | 5,108 | 4,851 | 5.3% |
#21 | Nissan Sentra | 1,750 | 1,534 | 14.1% | 3,581 | 3,532 | 1.4% |
#22 | Volkswagen Golf | 1,645 | 2,038 | -19.3% | 3,952 | 4,202 | -5.9% |
#23 | Kia Forte | 1,623 | 1,047 | 55.0% | 3,015 | 2,468 | 22.2% |
#24 | Ford Edge | 1,489 | 2,259 | -34.1% | 3,405 | 4,598 | -25.9% |
#25 | Honda HR-V | 1,475 | 817 | 80.5% | 3,307 | 2,031 | 62.8% |
#26 | Ford Explorer | 1,468 | 1,121 | 31.0% | 3,568 | 2,541 | 40.4% |
#27 | Jeep Grand Cherokee | 1,384 | 1,353 | 2.3% | 3,523 | 3,495 | 0.8% |
#28 | Toyota Camry | 1,377 | 1,813 | -24.0% | 2,845 | 3,908 | -27.2% |
#29 | Toyota Sienna | 1,345 | 1,141 | 17.9% | 3,324 | 3,251 | 2.2% |
#30 | Subaru Impreza | 1,340 | 889 | 50.7% | 3,084 | 2,162 | 42.6% |
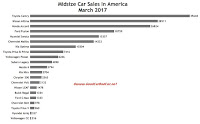
U.S. sales of midsize cars declined for a 13th consecutive month in March 2017, falling by more than 22% to only 168,598 units.
U.S. Vehicle Sales By Model - April 2017 YTDU.S. Car Sales Rankings By Model - March 2017 YTD
Led by the Toyota Camry, relatively strong in the sell-down leading up to the launch of an all-new 2018 model, midsize cars accounted for 11% of all new vehicle sales and 29% of passenger car volume, down from 14% and 33%, respectively, one year ago. The Camry's 4% downturn to 35,648 units – still more than enough for the Camry to be America's best-selling car overall in both March and Q1 of 2017 – was actually a bright spot.
Many of its competitors faced far greater challenges.Year-over-year, the Chevrolet Malibu, discontinued Chrysler 200, Ford Fusion, and Hyundai Sonata all reported losses of at least 35%. Double-digit percentage declines were also reported by the Honda Accord, Kia Optima, Nissan Altima, and Subaru Legacy.  |
| Click Chart To Expand |
Only the Buick Regal (soon to be replaced) and Volkswagen Passat (which faced its own dramatic downturn last year) reported year-over-year improvements in U.S. March 2017 midsize volume. Those cars account for less than 5% of the midsize segment.
Year-to-date, the Passat is joined by the rare Mazda 6 on the short list of midsize cars that are selling more often in 2017 than they did in 2016.
Dedicated hybrids and electrics in a similar price bracket, meanwhile, reported a collective 21% year-over-year improvement in March 2017. The Kia Niro, Toyota Prius Prime, Chevrolet Volt, and Chevrolet Bolt all deserve credit.
You can click any model name in the tables below to find historical monthly and yearly U.S. auto sales data. You can also select a make and model at GCBC's Sales Stats page. These tables are sortable, so you can rank midsize cars any which way you like. Mobile users can now thumb across the tables for full-width access. Suggestions on how GCBC should break down segments can be passed on through the Contact page.
Click Column Headers To Sort • February 2017 • March 2016 Midsize Car | March
2017 | March
2016 | %
Change | 2017
YTD | 2016
YTD | %
Change |
| 1334 | 1276 | 4.5% | 3308 | 5537 | -40.3% |
| 14,222 | 22,058 | -35.5% | 35,005 | 58,222 | -39.9% |
| 2565 | 4971 | -48.4% | 6620 | 15,915 | -58.4% |
| --- | 8 | -100% | --- | 23 | -100% |
| 18,759 | 29,675 | -36.8% | 50,786 | 74,994 | -32.3% |
| 26,824 | 30,523 | -12.1% | 69,815 | 77,073 | -9.4% |
| 15,357 | 28,778 | -46.6% | 37,869 | 61,457 | -38.4% |
| 10,204 | 11,725 | -13.0% | 26,945 | 29,768 | -9.5% |
| 3794 | 4094 | -7.3% | 10,692 | 10,283 | 4.0% |
| 28,511 | 34,856 | -18.2% | 73,985 | 85,332 | -13.3% |
| 4898 | 5551 | -11.8% | 12,703 | 14,478 | -12.3% |
| 35,648 | 36,991 | -3.6% | 83,459 | 96,245 | -13.3% |
| 216 | 361 | -40.2% | 562 | 991 | -43.3% |
| 6266 | 6097 | 2.8% | 18,267 | 14,063 | 29.9% |
--- | --- | --- | --- | --- | --- | --- |
Total | 168,598 | 216,964 | -22.3% | 430,016 | 544,381 | -21.0% |
Hybrids & Electrics | March
2017 | March
2016 | %
Change | 2017
YTD | 2016
YTD | %
Change |
| 978 | --- | --- | 3092 | --- | --- |
| 2132 | 1865 | 14.3% | 5563 | 3987 | 39.5% |
| 1333 | 1702 | -21.7% | 3594 | 4059 | -11.5% |
| --- | 2 | -100% | 1 | 21 | -95.2% |
| 327 | --- | --- | 332 | --- | --- |
| 2704 | --- | --- | 4889 | --- | --- |
| 3 | 1 | 200% | 4 | 8 | -50.0% |
| 1478 | 1246 | 18.6% | 3287 | 2931 | 12.1% |
| 7416 | 8137 | -8.9% | 20,115 | 21,655 | -7.1% |
| 5798 | 8130 | -28.7% | 15,769 | 21,632 | -27.1% |
| 1618 | 7 | 23,014% | 4346 | 23 | 18,796% |
| 960 | 1331 | -27.9% | 2619 | 3648 | -28.2% |
--- | --- | --- | --- | --- | --- | --- |
Total | 17,331 | 14,284 | 21.3% | 43,496 | 36,309 | 19.8% |
RECOMMENDED READINGMidsize Car Sales In America - February 2017Midsize Car Sales In America - March 2016Top 20 Best-Selling Cars In America - March 2017U.S. Auto Sales Brand Rankings - March 2017Large Car Sales In America - March 2017Small Car Sales In America - March 2017


